Create Chart Image from Table
Description
Generate a chart image from a table to visually represent your data for clearer insights.
Supported input formats:
- JSON
- CSV
Input Arguments
| Input Argument | Type | Description | Required? | Advanced Option? | Default |
|---|---|---|---|---|---|
Table Data | Table in JSON or CSV format | The table in JSON or CSV you want to create a chart of. | ✔️ | ❌ | - |
Chart Type | Choice Field | Chart type of the generated image. | ❌ | ❌ | Bar |
Image Width | Number | Width of the image in pixels. | ❌ | ✔️ | 500 |
Image Height | Number | Height of the image in pixels. | ❌ | ✔️ | 500 |
Background Color | String | Background color in RGB, HEX, HSL or color name. | ❌ | ✔️ | transparent |
Output Format | Choice Field | Output format of the created image. | ❌ | ✔️ | PNG |
Response
| Response | Type | Description |
|---|---|---|
File response | File | The generated chart image file. |
File as String | String | Base64-encoded string representation of the chart image. Useful for storing in variables. |
MIME type | String | MIME type of the output image, e.g., *image/png. |
Extension | String | File extension of the output image, e.g., png, jpeg. |
Power Automate Examples
Create Chart Image from Table
We use random product sales data in CSV format and set the chart type to line.
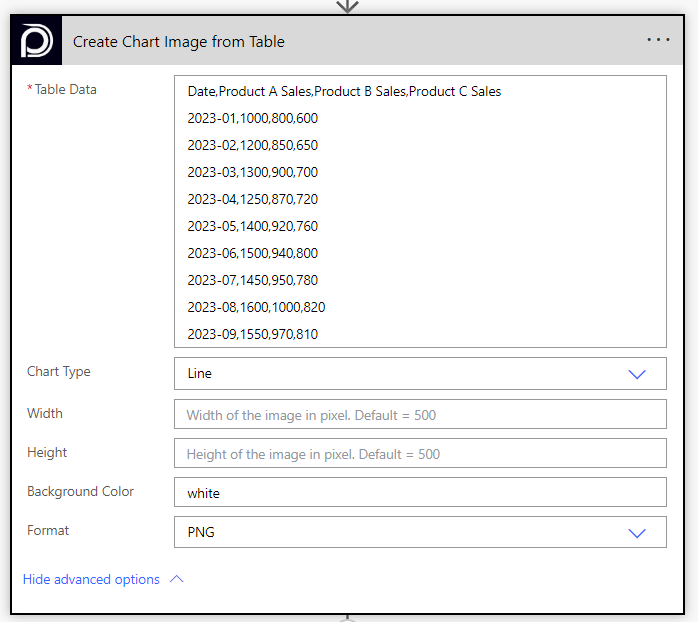
As advanced options we may choose the picture's width, height, background color and format.
Known Limitations
⚠️
If you experienced other limitations please get in touch with us!