Create Image Chart from Table [DEPRECATED]
This action is deprecated, meaning it is outdated and no longer maintained. It can still be used, but the updated version here (opens in a new tab) includes new features and bug fixes.
Description
Generate a chart image from a table to visually represent your data for clearer insights.
Supported input formats:
-
JSON -
CSV
Input Arguments
| Input Argument | Type | Description | Required? | Advanced Option? | Default |
|---|---|---|---|---|---|
JSON or CSV | Table in JSON or CSV format | The table in JSON or CSV you want to create a chart of. | ✔️ | ❌ | - |
Response
| Response | Description |
|---|---|
Image | Chart containing the table. |
Power Automate Examples
Create Chart Image from Table
We use random Product Sales Data in CSV format and choose the chart type to be bar.
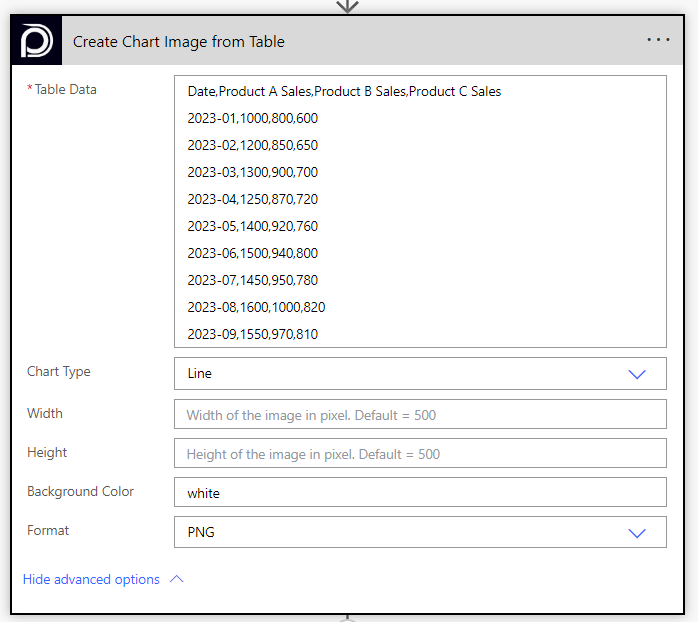
As advanced options we may choose the picture's width, height, background color and format.
Power Apps Examples
Known Limitations
⚠️
If you experienced other limitations please get in touch with us!